Written by Pete Fowler. Soon to be Published in ASPE's Estimating Today.
Introduction
We are construction cost estimating consultants who work on 1,000 claims and litigation projects every year. We need to understand and evaluate estimates of every imaginable size, type, and format; and every level of quality, professionalism, and accuracy (or lack thereof). Then we need to explain these estimates to our clients, who are very smart, but most of them have no background in construction, and many have no shame in acknowledging they are terrible at math. This article will explain where we begin.
Like all professional estimators, our estimates need to be correct; that is, accurately reflect the costs to perform the scope of work and/or accurately predict a reasonable price we will or would receive in bids from qualified contractors. Unlike traditional estimating, our opinions need to be supported to the point that they can withstand brutal cross-examination from opposing attorneys and experts, and still stand. We can't just say "The price is the price" like a contractor might.
We must show our work. Just like in math class, simply getting the answer right does not earn the student an A+. We have to show how we came to our conclusions. Our work is “forensic” so we need to approach it "scientifically," and apply best practices from standard setting groups like ASPE.
Explain it to Pete’s Mom
I wrote my first magazine article more than 25 years ago. The editor said in frustration "Damn it! Stop using 25 cent words!! We need to get this down to the 5th grade reading level." I thought ugh, construction folks are dumb. But when it was published my architect, engineer, and attorney colleagues congratulated me on a great, clear, easy-to-read piece. I learned that even people who CAN read at the collegiate level don't WANT to. In our office, when someone starts using big words and long sentences, or technical jargon that requires construction experience to understand, we say "Explain it to Pete's Mom. She is smart but has no construction experience; just like our clients, opposing attorneys, judges, and juries."
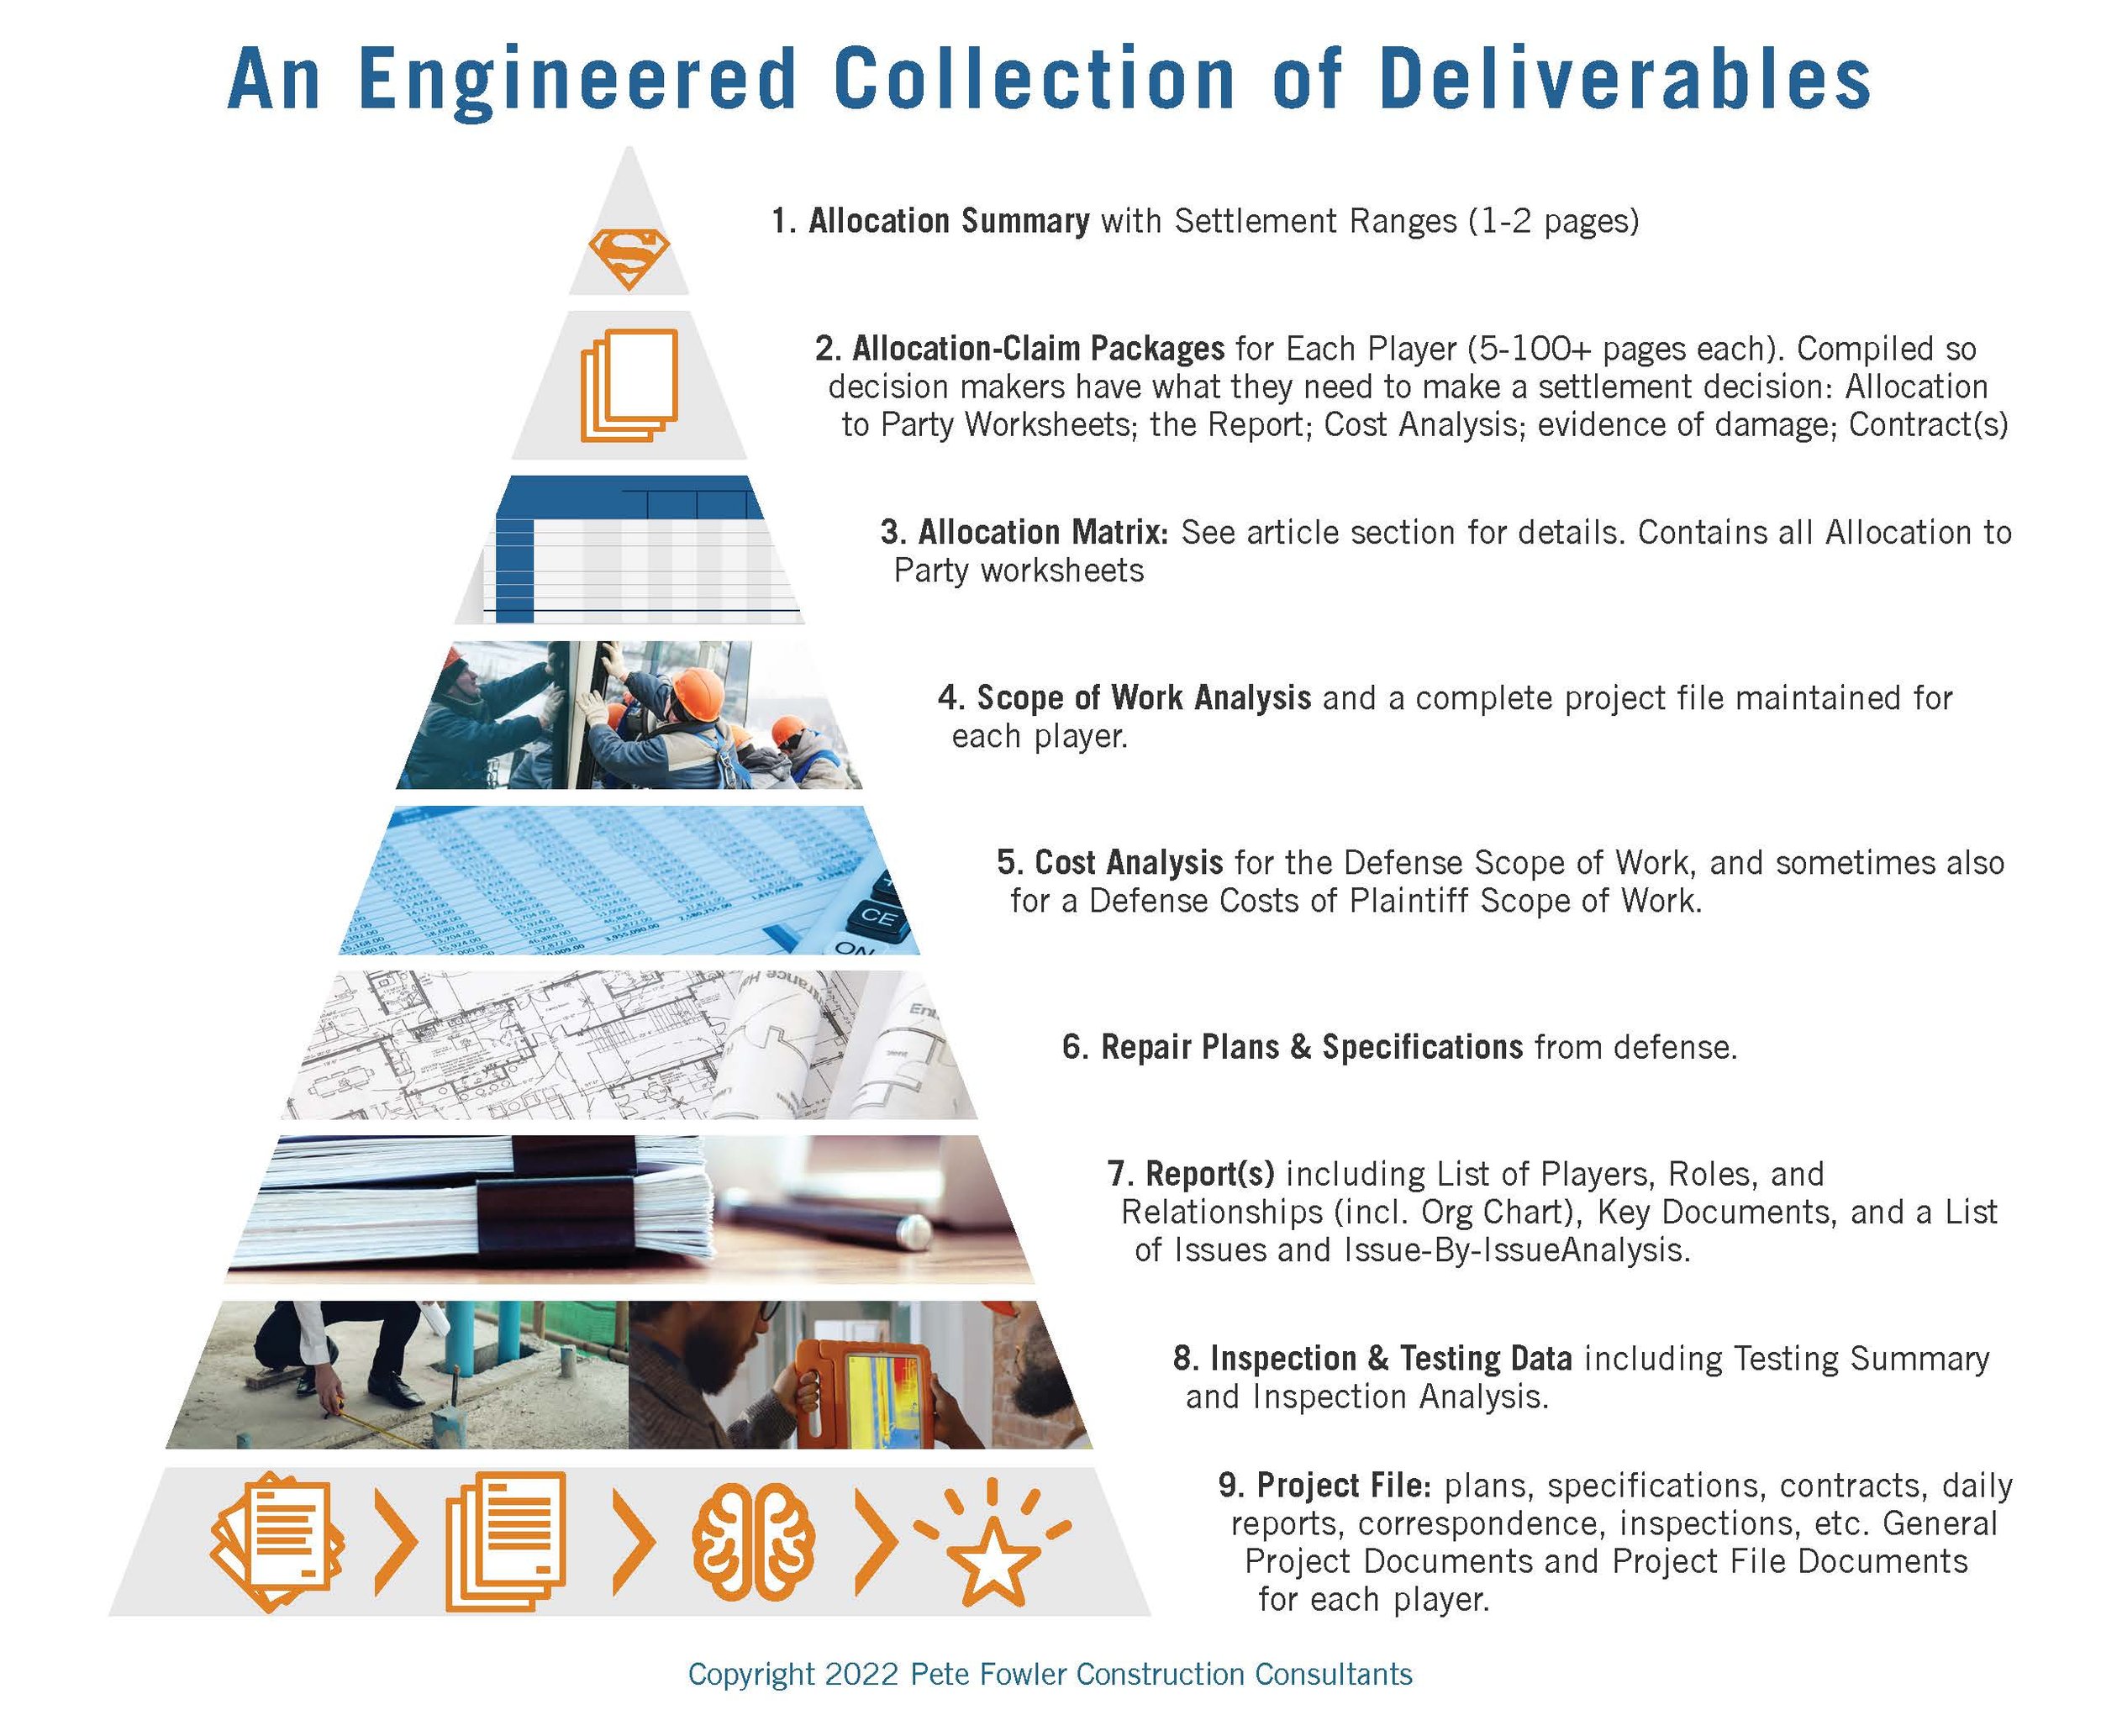
We have also found that there is special power, magic even, in a well crafted one page summary. Even the most complex project can be summarized sensibly in 500 words. And so can any estimate, no matter how large the bottom line. These 1-pagers should be organized "sensibly." Published in 1956 "The Magical Number Seven, Plus or Minus Two" remains one of the most cited papers in psychology. Researchers figured out why so much of our world is organized into groups of 5-9 items (like days of the week, wonders of the world, deadly sins); the number of objects humans can hold in working memory is 7 ± 2. We often use this fact in our work. All project management professionals know a "Work Breakdown Structure" should conform with this fact by chopping 100% of a project first into 5-9 chunks, then each subsequent level into another 5-9 chunks, then each again, until the entire project is outlined, organized, and numbered in manageable work packages.
"A picture is worth 1,000 words" is a common adage because it is true. We have found the right graphic can be worth 1,000 pictures. A good graphic is often a marked-up picture, explained with small words and short sentences.
Estimating Fundamentals
We have had to explain the fundamentals of professional cost estimating thousands of times. Our standard estimate format includes the following components, usually in linked spreadsheets: Estimate Summary, Estimate Details, Quantity Take Off, Labor Rates, Material - Equipment - Subcontractor Costs, and General Conditions. We often draw these components side-by-side and then draw lines to show where they connect.
We explain how the "direct costs" include all of the labor, materials, equipment, and subcontractor costs (that include labor, materials, equipment, sub-subcontracts, and indirect costs). We then explain that "indirect costs" include general conditions (project specific overhead like trailers, portable toilets, etc.), overhead (general costs for rent, phones, salaries, etc.), profit (which is NOT a dirty word), and other or non-construction project costs like design, permits & fees, third party inspection, etc.
Analysis
Virtually all of our work is performed in multiple passes, each at an increasing level of depth and accuracy, often organized into five levels, beginning with a preliminary analysis (level 1) and concluding with trial testimony (level 5). Preliminary estimate analysis should begin with the estimate (proposal, bid, etc.) either printed or electronic, a blank page, and a pen. We find the total project cost and then the largest chunks (usually the top 5-9). Initially we are trying to understand the organizational scheme and the scope of work. At level 1 we are intentionally looking at the big picture (forest perspective), making sure to not get lost in the details (staring at trees).
Professional estimators would be surprised how often the work of other estimators contains obvious errors, omissions, or duplicative costs. When I started doing this work in the mid-1990s, I went years before analyzing an estimate that was free of obvious errors. When I find errors, I write or draw on the document, and make a list of them as talking points. I make sure I can "Explain it to Pete's Mom" (the errors) on a single page, or maybe two if I use an image of the estimate being analyzed.
Deciding where to focus is easy: On the BIG numbers. We always need to keep in mind how much time we have for this analysis. For a desktop review, we might only have an hour. If it's a contentious $25 million litigation with an impending trial date, we have to know where every penny is going. Regardless, in less than an hour we should know if the work passes "the sniff test." Is it reasonable? Our clients think "A closed claim is a happy claim" so if it's 5% high, they might just want to know that so they can hurry and settle. Unfortunately for them, more than 100% high is all too common.
Preliminary analysis of these big numbers is usually easy. If we add up all the costs to remove and replace industrial grade carpet, and divide by the total square feet, and get $100/SF, then we know we have a problem. This kind of silliness happens. More commonly, rather than outrageous cost per unit, they will slightly inflate the cost, and slightly inflate the number of units. When enough of this is done in aggregate, the inflation is significant. The easiest way to inflate or deflate an estimate is to add or subtract big chunks of work. An example is removing & replacing elements like roofs, siding, cabinets, or flooring, when a repair is all that is necessary.
More detailed analysis (beginning at level 2) is best performed in a spreadsheet that includes math checks. Beginning with the largest figures, we drill backwards, sometimes using Toyota's "5 Whys."
For example: If Total Cost is $100,000. First "Why?" Item 3 is the largest item at $10,000. Second "Why?" Labor for that item is $4,000. Third "Why?" Because the crew rate is $100 per hour times 40 hours. Fourth "Why?" Because the blended cost of a two-person crew where one makes less than $40/hour and the other makes over that, plus labor burden at 30%, totals $100/hour (as described in detail in the Labor Rates worksheet), and the work is going to take an entire week. Fifth "Why?" Because there are 400 units of work to perform and a skilled two-person crew can perform 10 units of work per hour.
Our detailed estimates contain information adequate to explain every cost associated with building a project, as described above. But not all estimates have this level of detail. Sometimes we have to do our own detailed estimating to validate or invalidate someone else's work. Depending on the level of detail we may support our estimating with information sources that begin with our personal experiences, and estimate the costs stick-by-stick, making and documenting calls for prices of materials and equipment. We also use data from past projects, bids, estimating books, and even the internet (we are always careful with this one).
Finally, we need to leverage the special magic of a one-page summary, including a sensible list, small words, and short sentences. Often we can better "explain it to Pete's Mom" with some good diagrams.
Multiple Estimates
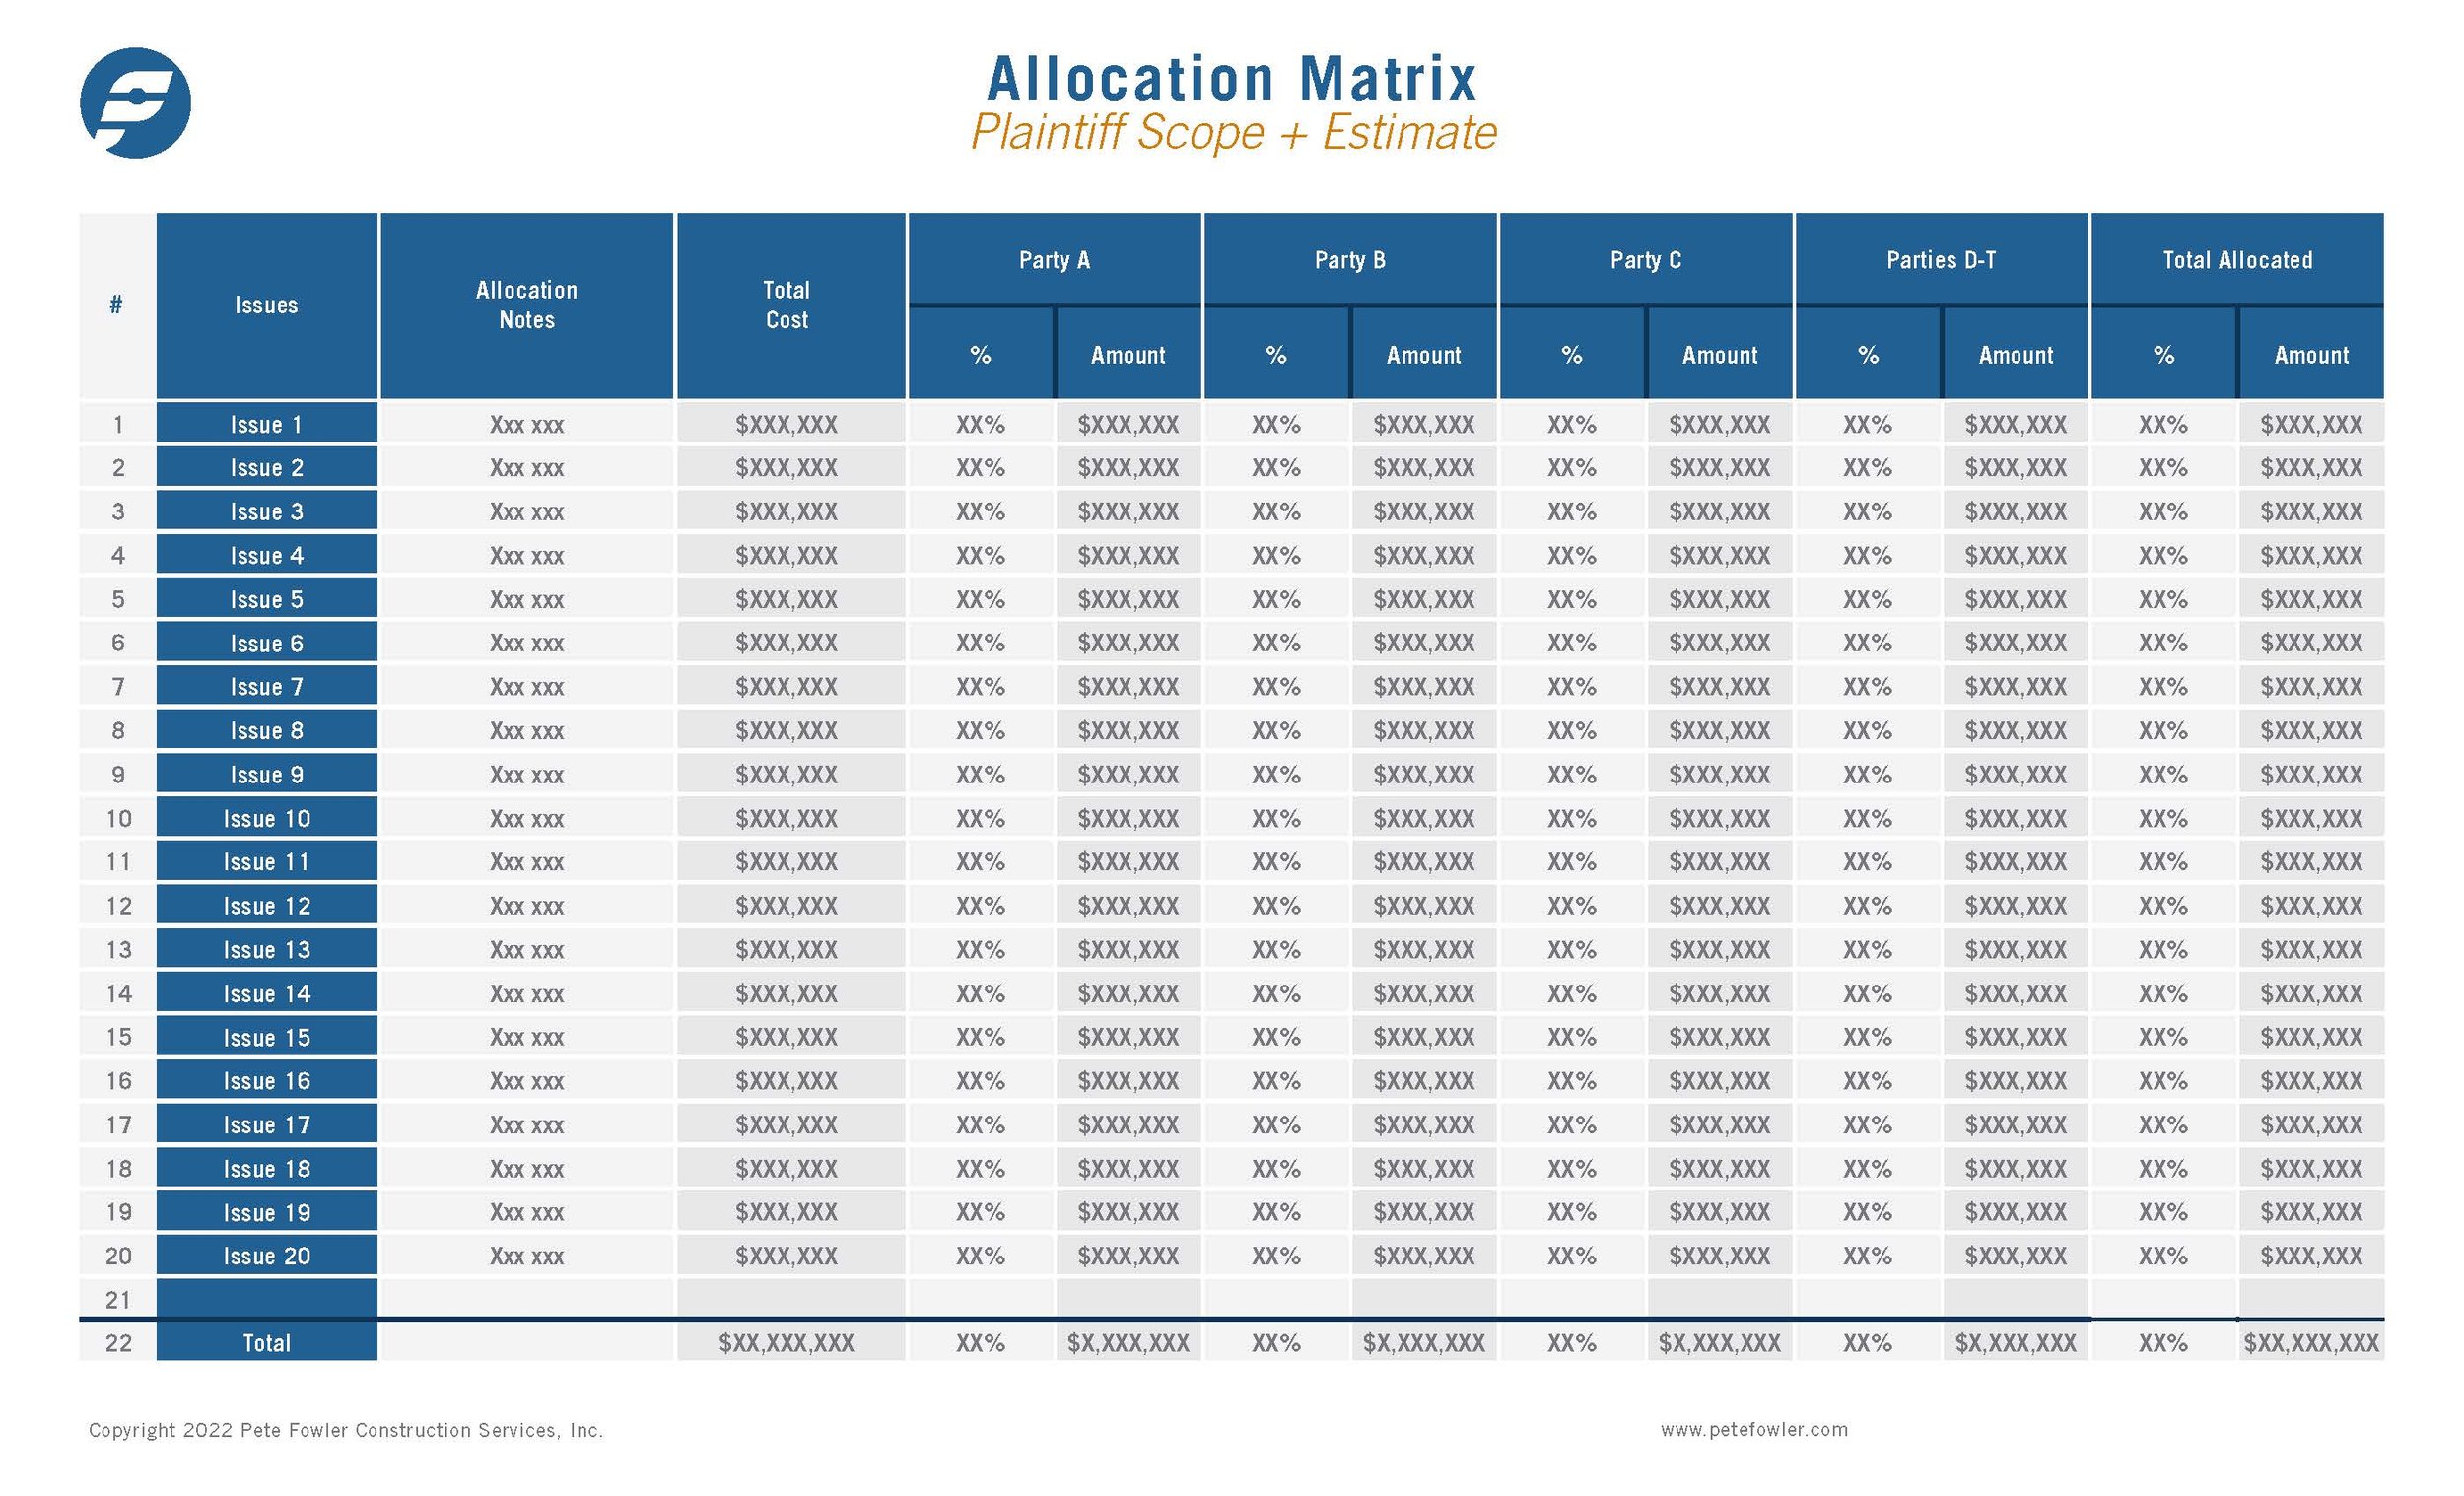
Once we understand an estimate, we often must compare it to one or more estimates. If everyone used the same estimate format and sensible lists, this would be an easy, secretarial job of typing words and figures into a spreadsheet. But it almost never is. So to make apples-to-apples comparisons we need to "normalize" the estimates. This often involves beginning with the most sensible estimate, and then taking the others, breaking them into their constituent parts and putting them back together in a way that they can be compared side-by-side and line-by-line. It's an imperfect science that requires judgement, but it can be done well. [See Exhibit A]

Exhibit A, Estimate Analysis & Comparison
This makes identifying the big differences easy. It is common for one estimate to have big numbers in a row where the other estimate has $0; typically meaning the scope of work is different. The differences we find are commonly found in a small number of line items. This makes comparison and exploration of the differences easier, which is done with small words, short sentences and simple graphics, often marked-up photographs.
Conclusion
Understanding & evaluating construction costs for building claims is simple, but not easy. In the end, professional cost estimators need to be right; they need to "explain it to Pete's Mom" with the right graphics, small words, and short sentences; and they need to show their work.